Find Out How the Internet is Trending in 2014


I thought this month I’d zero in on Mary Meeker’s KPCB Internet Trends 2014 Report published May 28th.
KPCB’s Report felt in some way less seismic in its impact as in previous years. On reflection this is probably because the Richter scale has been given a good working over since this Report’s first edition, and we’ve become accustomed to eye-watering growth figures etc. So context is everything, but when you look deeper, the changes sweeping the digital and mobile world remain immense.
Here are a few points I thought interesting.
Tablets are growing faster, (+53% during CY13), than PC’s did at anytime in their lifecycle with still huge growth forecasted. Smartphones that feel ubiquitous, particularly amongst this readership I suspect, have reached 30% of the total global 5.2Bn mobile base, so again, huge growth possible. This is assisted by the increasing affordability of the devices, with the cost of a unit decreasing about 5% annually since 2008. Mobile usage has reached 25% of total global web traffic, growing from 14% just last year, with Asia remaining the most mobile centric region with 37% of all page views (StatCounter, 5/14). In terms of hardware in our region, of the established smartphone markets, Japan ranks 2nd , Korea 5th , and Australia 9th. Of the so-called developing smartphone markets, China ranks 1st , India 2nd , Indonesia 4th , and the Philippines 10th . Shipments of smart devices are now tracking at 4-5x that of TV’s or PC’s.
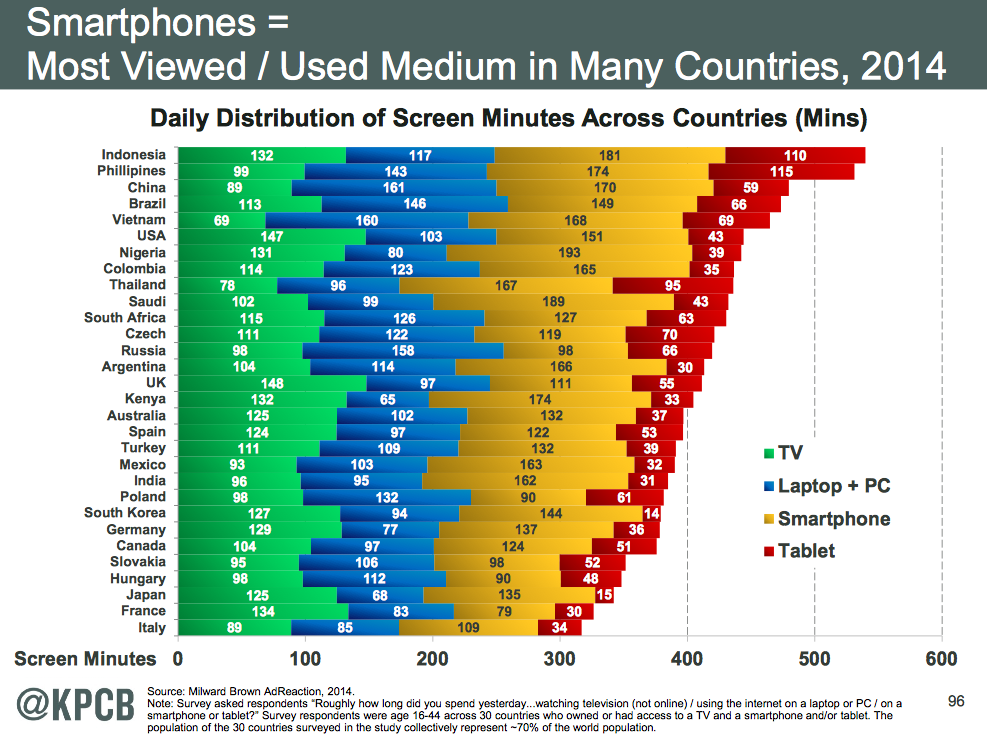
The Report highlighted data from Millward Brown’s AdReaction 2014 study showing how many minutes the populations of 30 countries, that together represent 70% of the world’s total population, spend looking at ‘screens’, the previous day. Screens were laptop, smartphone, tablet and also the TV screen, See chart below. The headline is that smartphones/tablets are the most viewed and used in many countries with four APAC markets in the top five; Indonesia, Philippines, China, and Vietnam, with the first two of those markets indexing particularly high also in tablet share. Slightly lower down the list, at 9th is Thailand, indexing very high in smartphone and notably in contrast the lowest of all 30 countries in TV share. Australia’s smartphone share is close to the average across the 30 countries surveyed, with tablets indexing lower.
Mobile data traffic achieved growth of +81% yoy with video a strong contributor. This is hardly new but it’s evidence that there’s voracious appetite for mobile content. The creation of high caliber programming and ad content to be put in front of quality audiences couldn’t be a bigger priority.
The Report cites a big revenue opportunity gap of $30Bn (USA) for Mobile to take up, this is based on time spent on device which is an often used metric but flawed I think, but whatever methodology, of course there’s a monetisation lag. The mobile industry’s capacity to exploit this undeniable opportunity is improving with the focus being applied in the right areas such as targeting and transparency. This does vary widely across our region but in Australia for instance, Mobile is taking increasing chunks of share with 21% of all Display in Australia that of Mobile Display, (iAB Australia).
China and its nearly 500 million Internet users come in for attention this year. Chinese internet brands are traveling at light-speed. Last year, only Tencent was in the top ten globally, this year it’s joined by three others; Alibaba, Baidu, and Sohu. And it’s Tencent’s mobile business that’s the stand-out, with WeChat proving to become a powerhouse of m-commerce with it’s 400 million active chat users using the service to pay for taxis, (5 million rides per day – March 2014), restaurants, and social gaming.
Looking at second-screening at home, (USA), sees 84% of mobile owners using devices while watching TV. Most common activities shows 49% of people surfing the web on smartphone and 66% on tablet. And shopping, (I assume including the ‘window’ variety), being undertaken 24% on smartphone and 44% on tablet.
The area of this years Report that is the most interesting is where we’re headed. Mary Meeker and her colleagues spend a large section on the intersection of findable and shareable data, wearable’s, sensors, and the internet of things, and this of course has great relevance to mobile. Data points such as, 1.8Bn photos uploaded and shared per day, Pintrest having 30Bn ‘pins, and 800M swipes a day on Tinder point to exponential behavioral changes. In fact IDC has two thirds of the digital universe being consumer originated. IDC also thinks that 34% of this sort of data could be useful. This is data from embedded systems, social media, photos, sounds etc), with 7% tagged, and 1% analysed so far. A good example of where this plays out is with the Jawbone health wearable which so far amongst it’s user base, has logged 27k years worth of sleep, and where it’s technology manages and makes sense of 50Bn activity data points every week then presents it’s insights on a rather nice app.
So across the 160 pages, there’s no lack of quality data, and it’s worth a read. For me the themes are, the mobile ecosystem continues it’s relentless advance, data and how it’s structured and used is gathering pace, second-screening is here to stay, better and better interfaces are helping drive traffic to mobile, and therefore, the opportunity for marketers has never been greater.
Mobile Hub.
Graham Christie
Partner, Big Mobile Group.
Please login with linkedin to comment
Latest News
TV Ratings (18/04/2024): I’m A Celebrity Wins Prime Time And Key Demos
Aussie viewers can be a harsh lot at times. Only days after Ellie Cole bled her heart out, she has been sent packing.
Effie&co Launches New ConnectAsia Division To Help Aussie Brands Market To Asian Consumers Overseas & At Home
Not provided is advice on using chopsticks and not spilling ramen down your shirt.
Cashrewards Sets Out Stall For New CMO
Thinking of applying for the Cashrewards CMO gig? Here are some insider tips that, yes, are tantamount to cheating.
‘I Ask For The TV Industry To Stand Up And Defend Itself’ – Seven Boss James Warburton Steps Down
The Seven supremo heads for the exits after five years. Here's hoping the Spotlight team organised the farewell bash.
Poh! Jamie! Adriano! Paramount ANZ reveals its tasty plans for this year’s MasterChef
It's your fan's guide to this year's MasterChef! Although no tips on how to pronounce crudités or use a un fait-tout.
Dentsu’s iProspect Partners With MOOD Tea Ahead Of May Campaign Launch
We love a Mood Tea here at B&T. Although we do store old screws and nails in the International Roast caterer's tin.
Opinion: When Culture Starts Eating Itself: Navigating The Age Of Self-eating Nostalgia
Born boss David Coupland asks is adland going through a nostalgia period? But please, no repeats of Best Of Red Faces.

Who’s Going To Cannes?! The TikTok Young Lions Winners!
It's Aussie adland's next gen! They're off to Cannes with high hopes of bringing back a Lion & a foot-long Toblerone.
Adobe Launches Express Mobile App With Firefly AI
Want to be the coolest kid at Friday staff drinks but forgot your retro Nikes? This new Adobe wizardry may do the trick.
ThinkNewsBrands & IMAA Extend News Publishing Education In Brisbane
Industry duo takes its publishing roadshow to Brisbane. Was disappointed no male attendees were wearing walk socks.
B&T Chats With Wavemaker’s Provocative Pioneers On Their Cross-Pacific Sojourn
B&T TV heads to Wavemaker's Sydney digs to interview two staffers from its New York & LA digs. If that makes sense?
HoMie & Champion Launch “Give One. Get One” Campaign Supporting Youth Homelessness Via Town Square
Much like the fête's prized chutney wears a blue winners sash, so too should this top initiative from HoMie & Champion.
Thinkerbell Takes Us Back To Summer In Latest Work For XXXX
This beer ad wants to take you back to summer! Just minus any chance of a shark attack on your morning bus commute.
Cannes Lions Unveils 2024 Programme Featuring Queen Latifah, Jay Shetty & P&G’s Mark Pritchard
Are you one of the lucky ducks heading to Cannes in June? Check out the headliner acts you'll be queueing hours to see.
Scroll Media Recruits Costa Panagos From Twitch
Costa Panagos set to bring South American flair to the Scroll offices. Assuming that he is, indeed, South American.
Year13, Microsoft & KPMG Australia Launch AI Course For Gen Zs
Born around the 2000s? Need to amp up your AI creds? This guide's for you (although it's not really that age specific).
General Motors Snares Heath Walker From Scania
Do you rage about oversized American cars on our roads? You need to bail up Heath Walker at parties & industry events.
VML Launches New “Envoyage” Brand For Flight Centre
VML unveils new brand for travel operator Flight Centre. Alas, no sign of those paid actors pretending to be pilots.
Subaru Places Media Account Up For Review
Subaru puts media up for review, as adland journos get set for mandatory "agency drives off with..." headline.
TV Ratings (17/04/2024): Contestants Faced With Harsh Realities As Alone Australia Heats Up (Or Cools Down)
Alone still doing the business for SBS. Overly long train journeys not doing the business, but they persist anyway.
Ben Fordham Loses Number One Spot As Ray Hadley Celebrates 156th Ratings Win
The radio numbers are in! Discover who's off for a boozy lunch today & who's waiting for the dreaded HR death knock.
Gourmet Ice Cream Brand Connoisseur Launches New “Thrill Your Senses” Iteration, Via SICKDOGWOLFMAN
Rattling the old "truth in advertising" adage comes this ice-cream spot full of noticeably thin people.
Paramount’s Global Sales Boss: ‘Australia’s Converged Model Is A Blueprint For How I’d Like All Of Our Markets To Be’
Paramount's global sales boss gives local sales ops the thumbs up. Didn't weigh-in on the Lisa Wilkinson debacle.
TikTok Starts Testing Its Instagram Rival In Australia
In exciting news for piano playing cats & brattish pranks in shopping centres, TikTok unveils its Insta rival plans.
Man Wrongly Named By Seven As Bondi Killer Hires Lawyers
Struggling to save for a house deposit? Why not get wrongly identified by Sunrise!
Smartsheet Appoints Indie Agency Sandbox Media To Its Media Account
Can't stand your colleagues? Like to dob them in when they miss a deadline? These work management platforms are ideal.
Boss Not Letting You Come To Cannes In Cairns? Use This Business Case To Convince Them!
Stingy boss won't spring for a ticket to Cairns? Add this to your persuasive argument repertoire. Or grovel.
Alt/shift/ Brisbane Builds Portfolio With Ausbuild Creative, PR, Content & Social Account Win
The Brisbane comms/PR agency lands constructor Ausbuild. Also hoping for a discount on its new glass conservatory.
Young Guns Versus The Old Guard: Who Adds More Value to Our Industry?
Cannes In Cairns poking this hornet's nest in a lively debate. Just so long as the oldies can get up the stairs.
70% Of Aussies Don’t Have Green Power Plans ENGIE Says In Major Brand Campaign Via HERO
Are you the notorious "light leaver on-er" in your flatshare? Quell any infighting with this green energy news.
PrettyGood Launches Offering Brand & Media Solutions For Australasian SMEs
B&T applauds the charitable nature of this new agency. Although we'd hate to see it impact any Chrissie present sends.
A Blunt End: Dolphins Medicinal Cannabis Sponsorship At Risk
Yes, it's another NRL drug story. Yet, thankfully it doesn't involve coke in Kuta during the off-season.
Slew Of New Creative Hires At Leo Burnett Australia
Ahhh, all black! The outfit of choice for agency creatives, David Jones staff and everyone in Melbourne.
Under Armour Unveils Local “Live in UA” Campaign
American apparel brand set for yet another tilt at the Aussie market, as Nike declares "we'll see about that".
Pepsi Launches New Look, Refreshing Classic Fashion Staples Via Special PR
Are you always the bridesmaid, never the bride, as the old saying goes? How do you think Pepsi feels?
Pure Blonde Returns To A Place Purer Than Yours In New Campaign Via The Monkeys
B&T's always been a huge fan of the 'drink yourself thinner' diet plan. So big thanks to Pure blonde, vodka & tequila.